
SPONSORED

Are prices actually up? They are based on the numbers comparing Q3 2019 vs 2020. The Q3 2020 reports* are out and they are showing prices have increased from one year ago at this time. The reality is that they are down. Please click on our Q3 Report to see a note from Bess Freedman (CEO), explaining some of the circumstances surrounding the confusing numbers. The current closings we are indeed seeing only reflect about 25% of the post-covid transactions which have been signed, since the shutdown began. So the true dislocation is trickling in, but we do not have enough information to define trends and/or make assumptions of what is really happening.
Everyone wants to know what the current discounts are; but, there is no blanket answer to that. The market is segmented into many different categories and they are all performing differently. The question is: are you comparing 1 bedrooms to 2 bedrooms or 3 bedrooms or even 4? Are you comparing coops vs. condos?…how about townhouse? Are you comparing velocity of sales or price per square foot? Are you accounting for inventory and/or days on the market? The comparative analysis is infinite. Consequently, I am going to try and focus on the most relevant from my point of view.
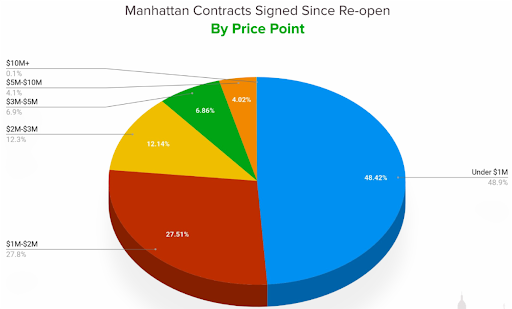
With the help of the two amazing charts and graphs, provided by Noah and John of UrbanDigs, we can determine quite a bit when comparing these categories. The majority of the deals being made, since the re-open of showings (June 22nd), are in the lower price points, where nearly 50% of all deals are below $1M and 75% of the total being less than $2M…and 88% below $3M. This volume/demand is reflective in the discounts you will see in the following graph.
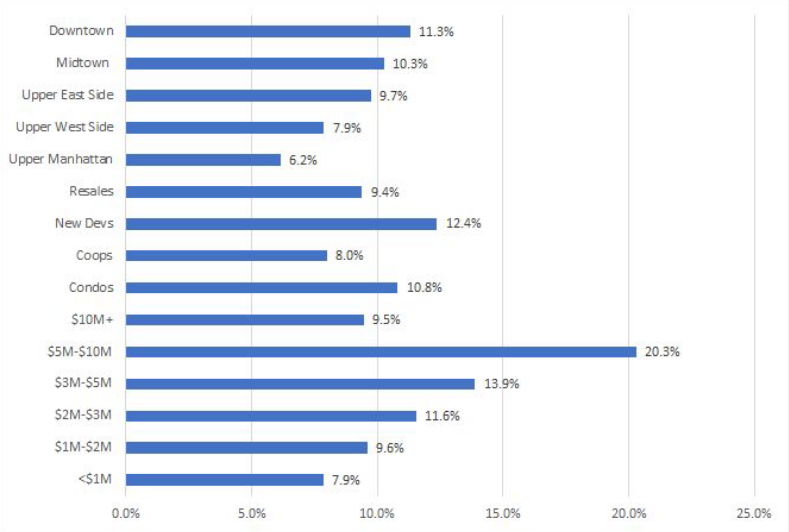
Depicted below are the discounts from the original asking price of all the closed deals that were signed since the shutdown (April 22nd, the date of our new reality). Note, these numbers are only reflective of approximately 25% of the deals that have been consummated during this time frame, as the remainder have still to close. That said, this gives us a pretty good indication as to where we are. A very clear takeaway is that discounts become more severe, as you go up the price scale.
Also, when comparing Resales to New Development deals there is most certainly a larger gap than what is on the surface. To support the price, developers tend to offer many concessions as an alternative to reducing the price, which could possibly add an additional 3-8% of net negotiability to the numbers below.
We can dissect the data until the sun comes up again, so I will wrap it up with just a few more additional thoughts:
- New contract activity, for September, was at 675 which surprisingly is virtually equal to the average over the past five years. Meaning deals are happening at a very decent clip; they are simply being out paced by the supply of new inventory.
- Inventory continues to rise, albeit at a slower pace than over the past several months since the re-open, up 20% YOY from 7,500 to 9,600. And that’s 60% higher than the average over the past five years.
Pricing remains to be the wild card with some sellers still aspirationally in a pre-covid world; that simply won’t work. Honestly, if sellers are not real and/or need-to-sell, they should pull their properties off the market. The excess inventory is diluting a marketplace which could run more efficiently. As their properties languish on the market, they are, collectively, eroding their own leverage putting unnecessary downward pressure on the prices they seek.
![]()
Click the button above to see the latest edition of our post-lockdown deals report, as of 9/29/20. The purpose of the report is to give you verified pricing data on deals negotiated after the NYS lockdown began on March 22nd. This is not meant to be a count of deals signed since the lockdown, as many of those haven’t closed yet.
To be included, a sale must meet all the following criteria:
1) Listed through the RLS, by all firms.
2) Have a contract signed after March 22, 2020
3) Closed and recorded on ACRIS
The spreadsheet, accessible through the above link, is a running total we add to each week. Keep in mind some sales may drop off if we find out the contract signed date was incorrect. Be sure to click on the respective tabs for each borough at the bottom of the document.
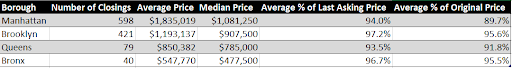
Below is a comparison of the data in this report to the same period last year:
 Roberto Cabrera
Licensed Real Estate Broker
Brown Harris Stevens
212.906.0554
Your City, Your Broker…
#YourCityYourBroker #NewYork #Manhattan