

By Bob Tannenhauser
The Upper West Side continues to show higher COVID-19 positivity rates than the city as a whole, according to the weekly data reported by the Department of Health. This does not take into account unreported self-tests.
Average 7-Day Positivity Rates
7 days Ending May 10th 7 days Ending May 17th
Zip Code 10023 11.21% 13.35%
Zip Code 10024 8.74% 10%
Zip Code 10025 8.6% 11.34%
Zip Code 10069 14.36% 9.41%
For New York City, the daily average positivity rate for the seven days ending May 20th was 9.5%, compared to the 28-day daily average of 9.61%. Total average daily cases increased to 4,078 for the seven-day period, up from the 28-day daily average of 3,432. Daily average hospitalizations decreased to 70 from 72, and 7-day daily average deaths increased to 7 from five, for the 28-day daily average.
The current alert level remains High.


These numbers tell us nothing.
I wouldn’t say they tell us nothing, but I find it’s best to follow the link in the article and click through all the tabs, looking at the helpful graphs for each, in particular on this page: https://www1.nyc.gov/site/doh/covid/covid-19-data.page#daily
Reply to Peter: Yes, the daily graphs (M-F) are the most telling data. You can see that both hospitalizations and total positives have declined in Manhattan over the past few days. The summaries are out of date almost as quickly as they are posted.
It takes several days for lagging data to be included, so those declines may actually be the opposite.
Thank you, Peter, for this link. Very useful info.
Actually, the graphs are not very helpful. Data corruption, sampling error and baseline assumptions are all significant, and graphic distortions like x/y axis manipulation and data series entry and exit points are commonplace.
Agree – what do these percentages represent?
The fraction of all those who took Covid tests in the past week? (so 11 of 100 tests were positive in 10023 ending May 10)?
Or the positivity rate in the entire population of those zip codes?
Please add perspective so we know how to interpret these. Thank you
Does no one ever question the ‘vaccine’ program? Why should this even be an issue in such a highly ‘vaccinated’ population? The jab should have brought this under control and it has not—time for a different approach—this is high alert after over a year of jabs
Because not enough people got vaccinated ayes or boosted. Plus tourists and no masks. Clearly, to you this is rocket science. Try a biological class.
I dunno, thousands of people aren’t dying every day in the city, so it seems like the vaccines have worked. But perhaps it’s not worth my time saying this because West Side Rag moderators will decline to publish this comment, while allowing through transphobia (see some of the comments on Sunday’s Title IX post) and dangerous medical info (like a comment from May 15 suggesting parents make their own baby formula).
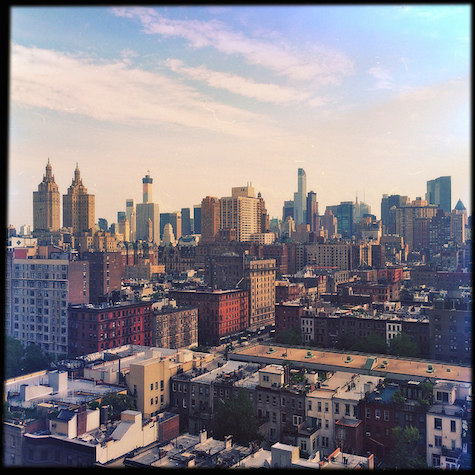
Photo credit for the CP Reservoir photo, Please. It’s a stunner.
Are you the photographer? We know a reader took it, but can’t find the name. Please identify yourself!
Agreed the image is a good one if undoctored, I love the El Greco clouds over the cityscape. Not crazy about the horizon across the middle of the picture. More sky, less foreground water.
Agreed that the COVID data is some sort of Rorschach test. The zip code map has 10023 (85+% vax rate?) being similar to the most conservative (lower vax rates) parts of SI and Rockaway beach. Without knowing who is being tested, why, and how often. My conclusion is that vaccines work, and the virus is out there. Wear a good mask if you’re vulnerable, because many people are done with it.
If the Covid testing sites went back to offering free PCR tests again, we’d all have a better idea of the actual numbers. I don’t understand how there are more of them popping up on the streets yet they will only do it if you’re insured. I spoke to one of the people working one and they told me they get 75% less people coming to them ever since this became the case.
I wonder why! I find this statistic very puzzling. Not what one would have expected. I do recall that, early in the epidemic, the UWS had a lower infection rate than other parts of the city. Why this change???
The report leaves the explanation up in the air!
Very simple general explanation: earlier in the pandemic, the poorer areas of the city, where people had to be out of the house and with others to work, and where vaccination rates were slower to climb, had higher rates of disease and showed higher test positivity*. After about the third week in March, as restrictions dropped and tourism had increased for a couple of weeks, the map flipped: the wealthy zip codes, those with restaurants and museums and hotels where people gathered, showed the highest positivity rates. TriBeCa was highest one week, the UWS several weeks, and again now.
Wear masks indoors in public, avoid crowds, think of ventilation. Consider the vulnerable. There are not many deaths in a highly vaccinated population but this remains a wily and opportunistic virus which can bring nasty consequences.
(*Yes, test positivity depends on the number of people testing, which may be somewhat biased towards those who have concern they are sick. But earlier when there were more testing requirements for work and entry to place, and especially before home testing was common, the numbers for each zip code were still always high enough for the percentage to offer a representative, if not exact, sample of that population. The data is quite transparent and the relative picture helpful.)
I have a small sampling. Married couple in West Chester. both vaccinated. She tested positive on day three.. on home tests . He had symptoms went to an Urgent Care. Tested positive. He got a notice from the dept of health… Telling him to make sure he STAYED HOME — But a list of demands. I am fine with that— BUT.. his wife got nothing from the Dept of health. Cause she did a home tests.. So think the numbers are way higher than you think because of hometests.
WHY ARE THE TESTS NOT FREE AROUND TOWN SO PEOPLE CAN REGISTER THEIR RESULTS AND WE CAN GET A REAL IDEA OF WHEN WE MIGHT WANT TO WEAR MASKS etc.. This is so sad ..
it is simple wear masks
https://www.covid.gov/tests
Fill out name and address for the third round of free COVID at home antigen tests. The super power of this virus is still asymptomatic infection and transmission. (Testing positive vs. coming down with illness).
The PCR test tells you if you been infected. It stays positive weeks/months after you’re no longer spewing out the virus.
Wondering if there can be any possible silver lining iof herd immunity down the pike if the infection rate doesn’t let up…??
Sounds like moderna and Pfizer vaccines give you the best defense against severe illness to start with. If you then suffered a bout of Covid from the Omicron varieties, that leaves your system with more protections. Comined with the previous vaccine effects, you then have that now seems the broadest available defense against a number of variants.
However, again from what the experts say, there isn’t any guaranteed total immunity – this is a coronavirus, like the common cold. So mild illness and recurrence every few months may still be possible. If there are a lot of cases around you, masks (and ventilation etc) lower your chances of infection. Depending on your age and risk factors, boosters will raise your short term defense levels as they decline.
A good source for info like this: the podcast and well annotated episode source pages for TWIV (“This Week In Virology”) “clinical update” episodes. Daniel Griffin MD PhD who sees patients and reads studies to keep info current, and host virology professor Vincent Racaniello PhD.
Yes. Great podcast.
As you say, the problem is the vulnerable people. Everyone should care about them before they die.
Will there be herd immunity? OR more time for the virus to mutate?
Herd immunity applies to viruses that don’t mutate, like measles and polio.
Where a virus mutates (flu, colds), herd immunity isn’t going to keep you from infection.