
Dear Subscriber,
Welcome to this fifth edition of the “Upper West Side Real Estate Market Bulletin” a monthly digital newsletter that covers the state and direction of our local real estate market. It focuses on (1) identification and evaluation of the principal forces that are propelling our market, and (2) be presented in plain and simple language to our lay readership.

Market Summary
The Fed’s priority is to reduce inflation from its current 8.0% level to a target of 2 to 3 % to minimize stress on pensioners and other fixed income parties. Unfortunately, its principal tool for doing this is Raising interest rates, which is antithetical to the economy, creating a need to maintain a delicate balance economic health and the rate of inflation, and so far not succeeding to any degree.
Our real estate market has been sluggish for months, largely because of escalating interest rates, and it’s likely it’s likely that this malaise will continue for the foreseeable future.
Inflation
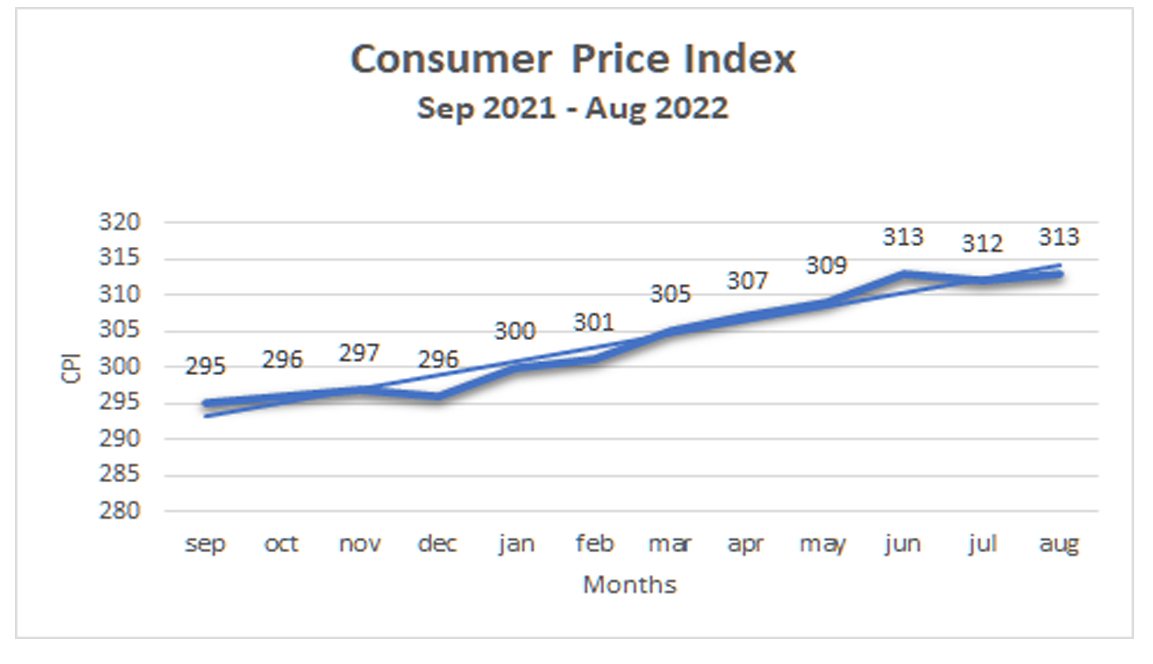
So far this year two rate increases of 0.75 % each have already been implemented, and a third increase is currently planned. As you can see on the graph the US CPI has doubled in the year and appears to be trending even higher, unfortunately putting upward pressure on mortgage rates, much to the detriment of our real estate.
Mortgage Rates
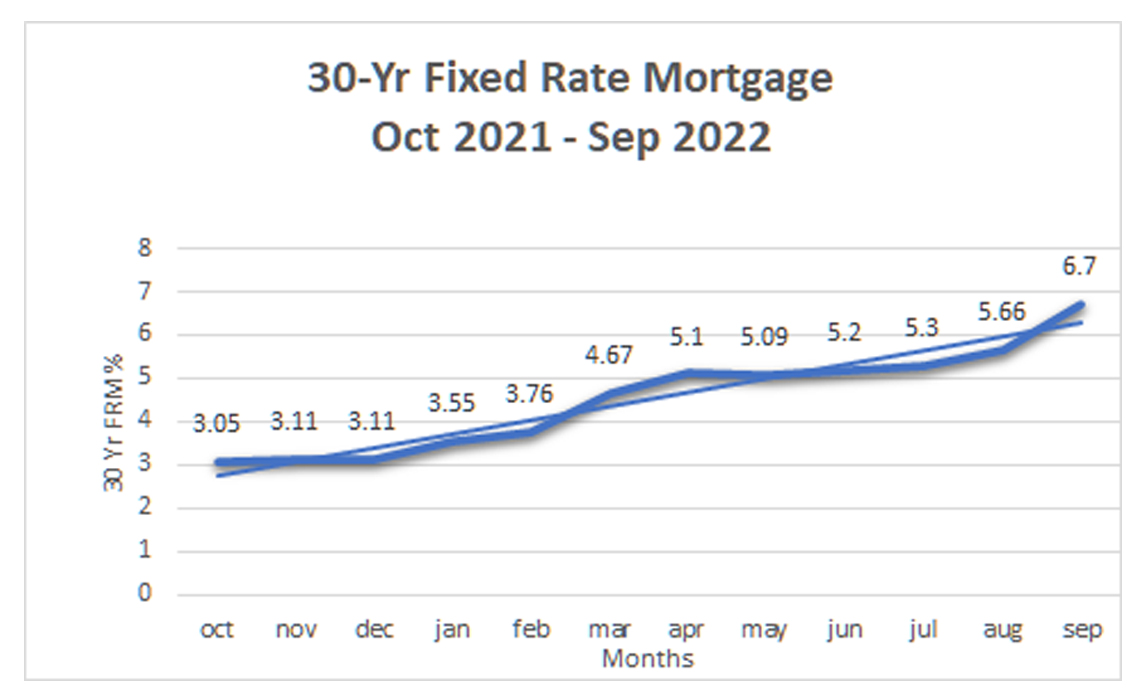
Mortgage rates have virtually doubled over the past year. Our real estate market, following the lead of the economy’s rate structure in general, has not yet responded to this interest rate therapy.
Consumer Confidence
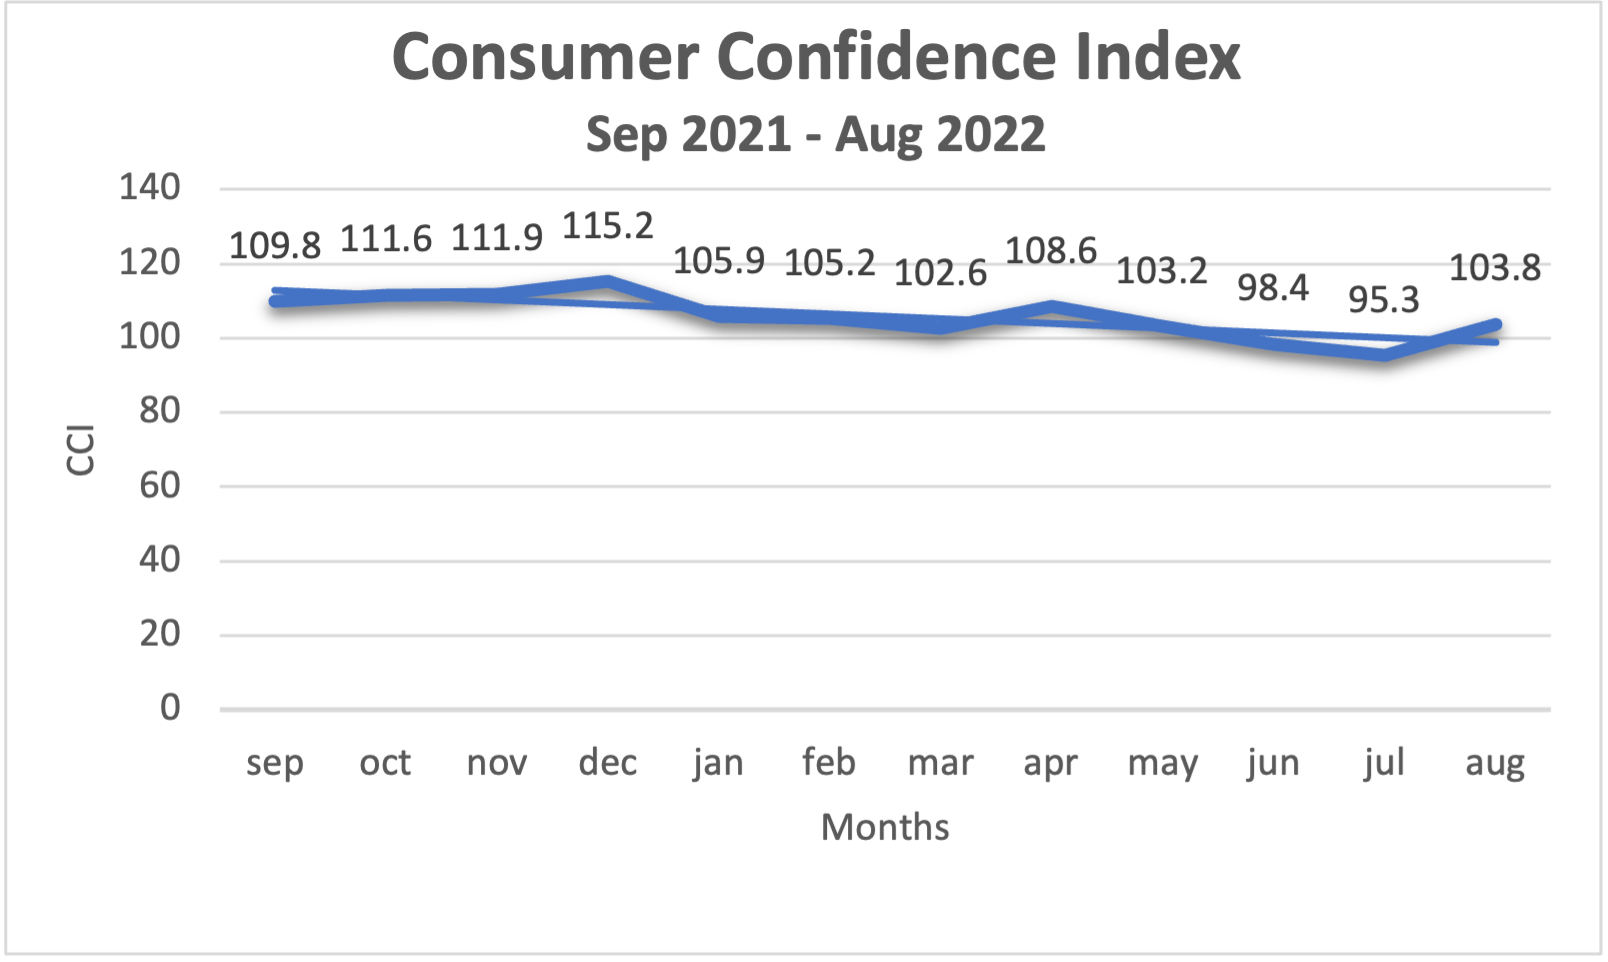
The Consumer Confidence Index (CCI) is a leading indicator which foretells the collective consumer attitudes about the US economy in general and its associated impact on employment, purchasing power and savings. As an index, values above 100 are considered positive and below 100 to be negative. The graph presents a seriously worsening attitude among consumers and foretells the likelihood of a recession.
What do the tea leaves say?
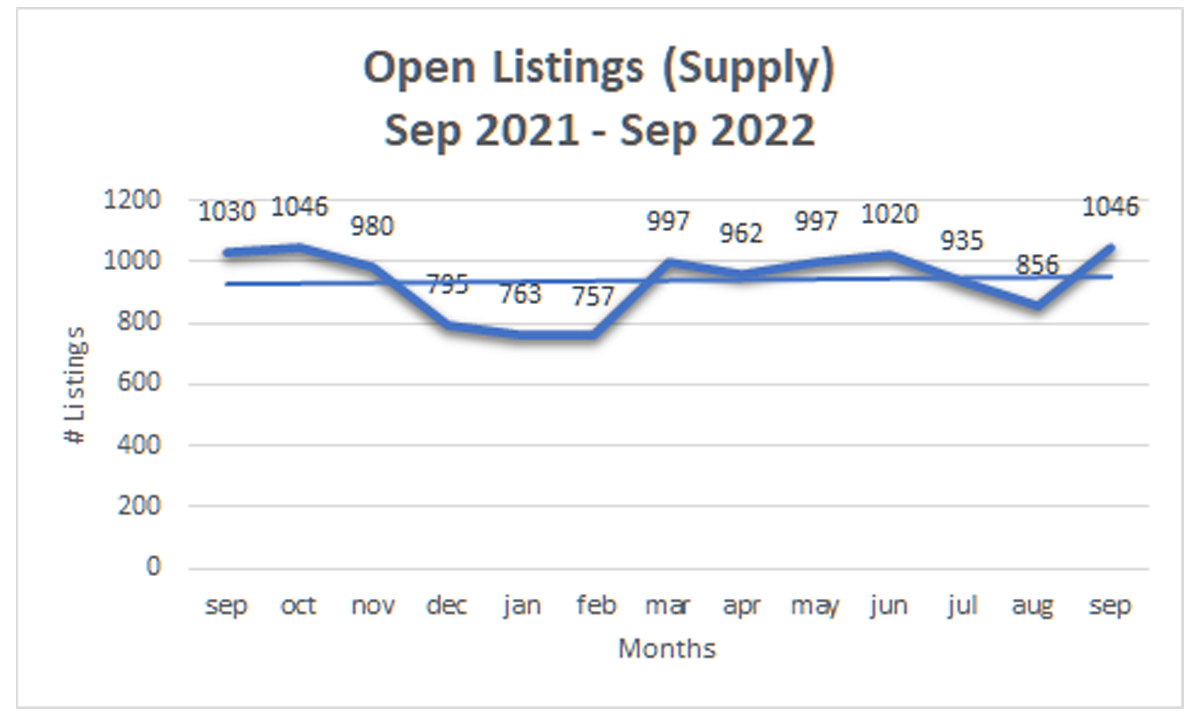
For our purposes, the tea leaves are graphs of UWS “Median Sale Price” and the “Supply of Open Listings”. Both of these key metrics indicate a continuing softness since the “Median Sale Price” hit an inflection point in February, following a downward trend since. “Open Listings (Supply)” shows a consistent lack of growth, indicating that property owners are reluctant to list their properties during periods of weakened pricing. September data confirms that trend. Typically sellers who are listing now need to sell now and are more willing to negotiate.
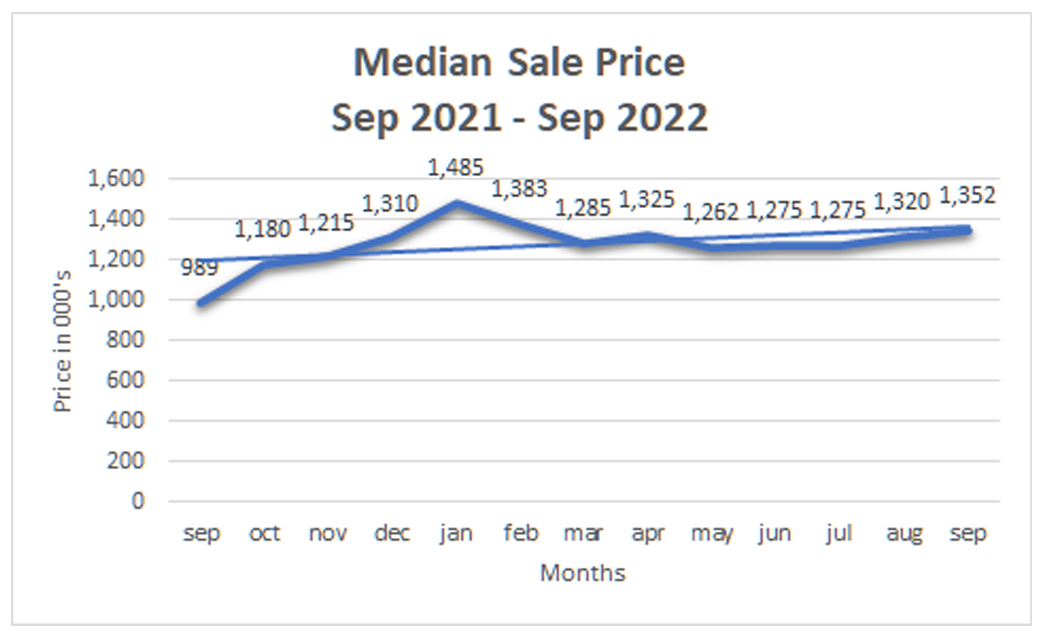
If you’re interested in learning more about this option, just click on the link below to review methods for identifying and transacting exceptional down market deals.
Data provided by Urban Digs


The chart that is supposed to show the Consumer Price Index actually shows Gross National Product.
Ray,
Thanks for your comment.
Axis on chart 1 is labeled CPI as in consumer price index, and it does not show a pronounced downward slope.
Jacey,
Thanks for your comment.